The Short Answer
An offshore engineer’s day is lost largely to friction around the work, and developers name finding information, meetings, and switching between tasks as the biggest culprits. A company can remove some of it at the source, such as a slow start on a new machine or a device that fails overnight. The rest needs a clear weekly view of how the team’s work is going.
We call the full list of what slows one engineer’s seat the friction ledger. It sits beside the seat cost stack in our laptop cost article, which counts money where the ledger counts hours instead. This article sets out what goes in it, who is responsible for each line, and which lines a managed work machine changes.
[[takeaways An offshore engineer’s day is lost largely to friction around the work, and developers name finding information, meetings, and switching between tasks as the biggest culprits. || A question that takes two minutes across a desk waits for the next working day. || A managed work machine changes four of the nine lines outright and helps with two more in part. || A manager who can’t see where the friction sits can only guess at it, and Atlassian found that only 42% of engineering leaders say they have the right metrics.]]
Where Does an Engineer’s Day Go in 2026?
Atlassian’s State of Developer Experience 2026, published in October, surveyed 1,155 developers and 405 engineering leaders. According to InfoQ’s report on the survey, these were the top sources of friction developers named:
[[stat 51% | Finding information || 50% | Meetings || 45% | Context switching, which means moving between unrelated tasks || 44% | Technical debt, the accumulated cost of earlier shortcuts in the code || src: Atlassian, State of Developer Experience 2026.]]
Put simply, the four biggest sources of friction all sit around the writing of code: finding answers, attending meetings, switching between tasks, and working around old shortcuts.
Microsoft’s 2025 Work Trend Index gives a sense of scale for knowledge work in general. Its Microsoft 365 data shows people interrupted every 2 minutes by a meeting, email, or notification, and 48% of the 31,000 workers it surveyed say their work feels chaotic and fragmented.
For an engineer, an interruption every 2 minutes leaves little uninterrupted time to work through a hard problem, which is why context switching ranks so high in the Atlassian list.
Both sets of figures rest on what people report, so they show how a working week feels from the inside. Hours logged don’t show work delivered either, as our piece on hard-to-measure risks explains.
Did AI Fix It?
AI has sped up part of the job. In the same Atlassian survey, 87% of developers say AI helps them ship work faster, and 72% also report the same or more friction than before AI. 65% regularly spend time correcting AI output, and about a quarter now say AI saves them 10 or more hours a week.
[[stat 87% | of developers say AI helps them ship work faster || 72% | also report the same or more friction than before AI || src: Atlassian, State of Developer Experience 2026.]]
The figures show where the hours go once code arrives faster. They go into reviewing output, searching for information, and coordinating with other people. Our 18 best practices for building a remote team covers the people side.
Why Is Friction Heavier for Offshore Teams?
Three things add to it when the team is offshore, and the first is the one we see hit hardest.
[[numbers 01 | Devices. | In our experience running offshore teams, a laptop has to be delivered, maintained, and retrieved across a border, and one that fails during the engineer’s working day may fail outside the hours your IT team is available. Short-term contracts feel it most, because the delivery and collection take the same effort however long the contract stays on for. || 02 | Time zones. | A question that takes two minutes across a desk waits for the next working day. || 03 | Distance from the people who can assist. | An engineer with no colleague at the next desk has fewer quick ways to find an answer, and finding information is the source developers rank first.]]
If you’re still weighing up the offshore model itself, our guide to offshoring tech jobs covers that decision.
What Goes in the Friction Ledger?
[[callout The friction ledger | The friction ledger lists each source of friction on one engineer’s seat, who usually owns it, and whether a managed work machine changes it.]]
[[table auto]]
Source of friction | Who usually owns it | Does a managed work machine change it?
Setting up a new machine | IT | Yes. HIQ does the setup. Your team’s only task is an initial consult on which machines you need and what they’re for.
Removing access when an engineer leaves | IT | Yes. The machine can be shut off at any time.
Finding information | Engineering lead | No
A device failing outside your working hours | IT support | Yes. Support runs 24/7, so someone is there to sort out the issue, which reduces downtime.
Context switching and interruptions | The team | Partly. A work machine is used for work, which leaves fewer things competing for an engineer’s attention. It doesn’t change how often the team’s own work pulls an engineer between tasks.
Meetings, including across time zones | The team | No
Software licensing and updates | IT | Yes. Licensing and maintenance are in the seat price.
Technical debt | Engineering | Visibility only. A work machine doesn’t pay debt down, but the weekly Code Quality measure shows how many quality issues new work introduces.
Unclear requirements | Product owner | No
[[/table]]
A managed work machine changes four of the nine lines outright and helps with two more in part. The other three need decisions from managers.
Happening Intelligence builds that machine for offshore engineering teams. The Precision Work Machine is a full Windows 11 Pro desktop that arrives ready to use, with software licensing, administration, security monitoring, and 24/7 support in the seat price. In most cases a new engineer’s machine is ready about 2 business days after the order. You can see the managed desktop on our virtual desktop page.
How Do You See Where the Friction Sits?
A manager who can’t see where the friction sits can only guess at it, and Atlassian found that only 42% of engineering leaders say they have the right metrics. Our article on managing outcomes you can’t directly measure covers the same visibility gap.
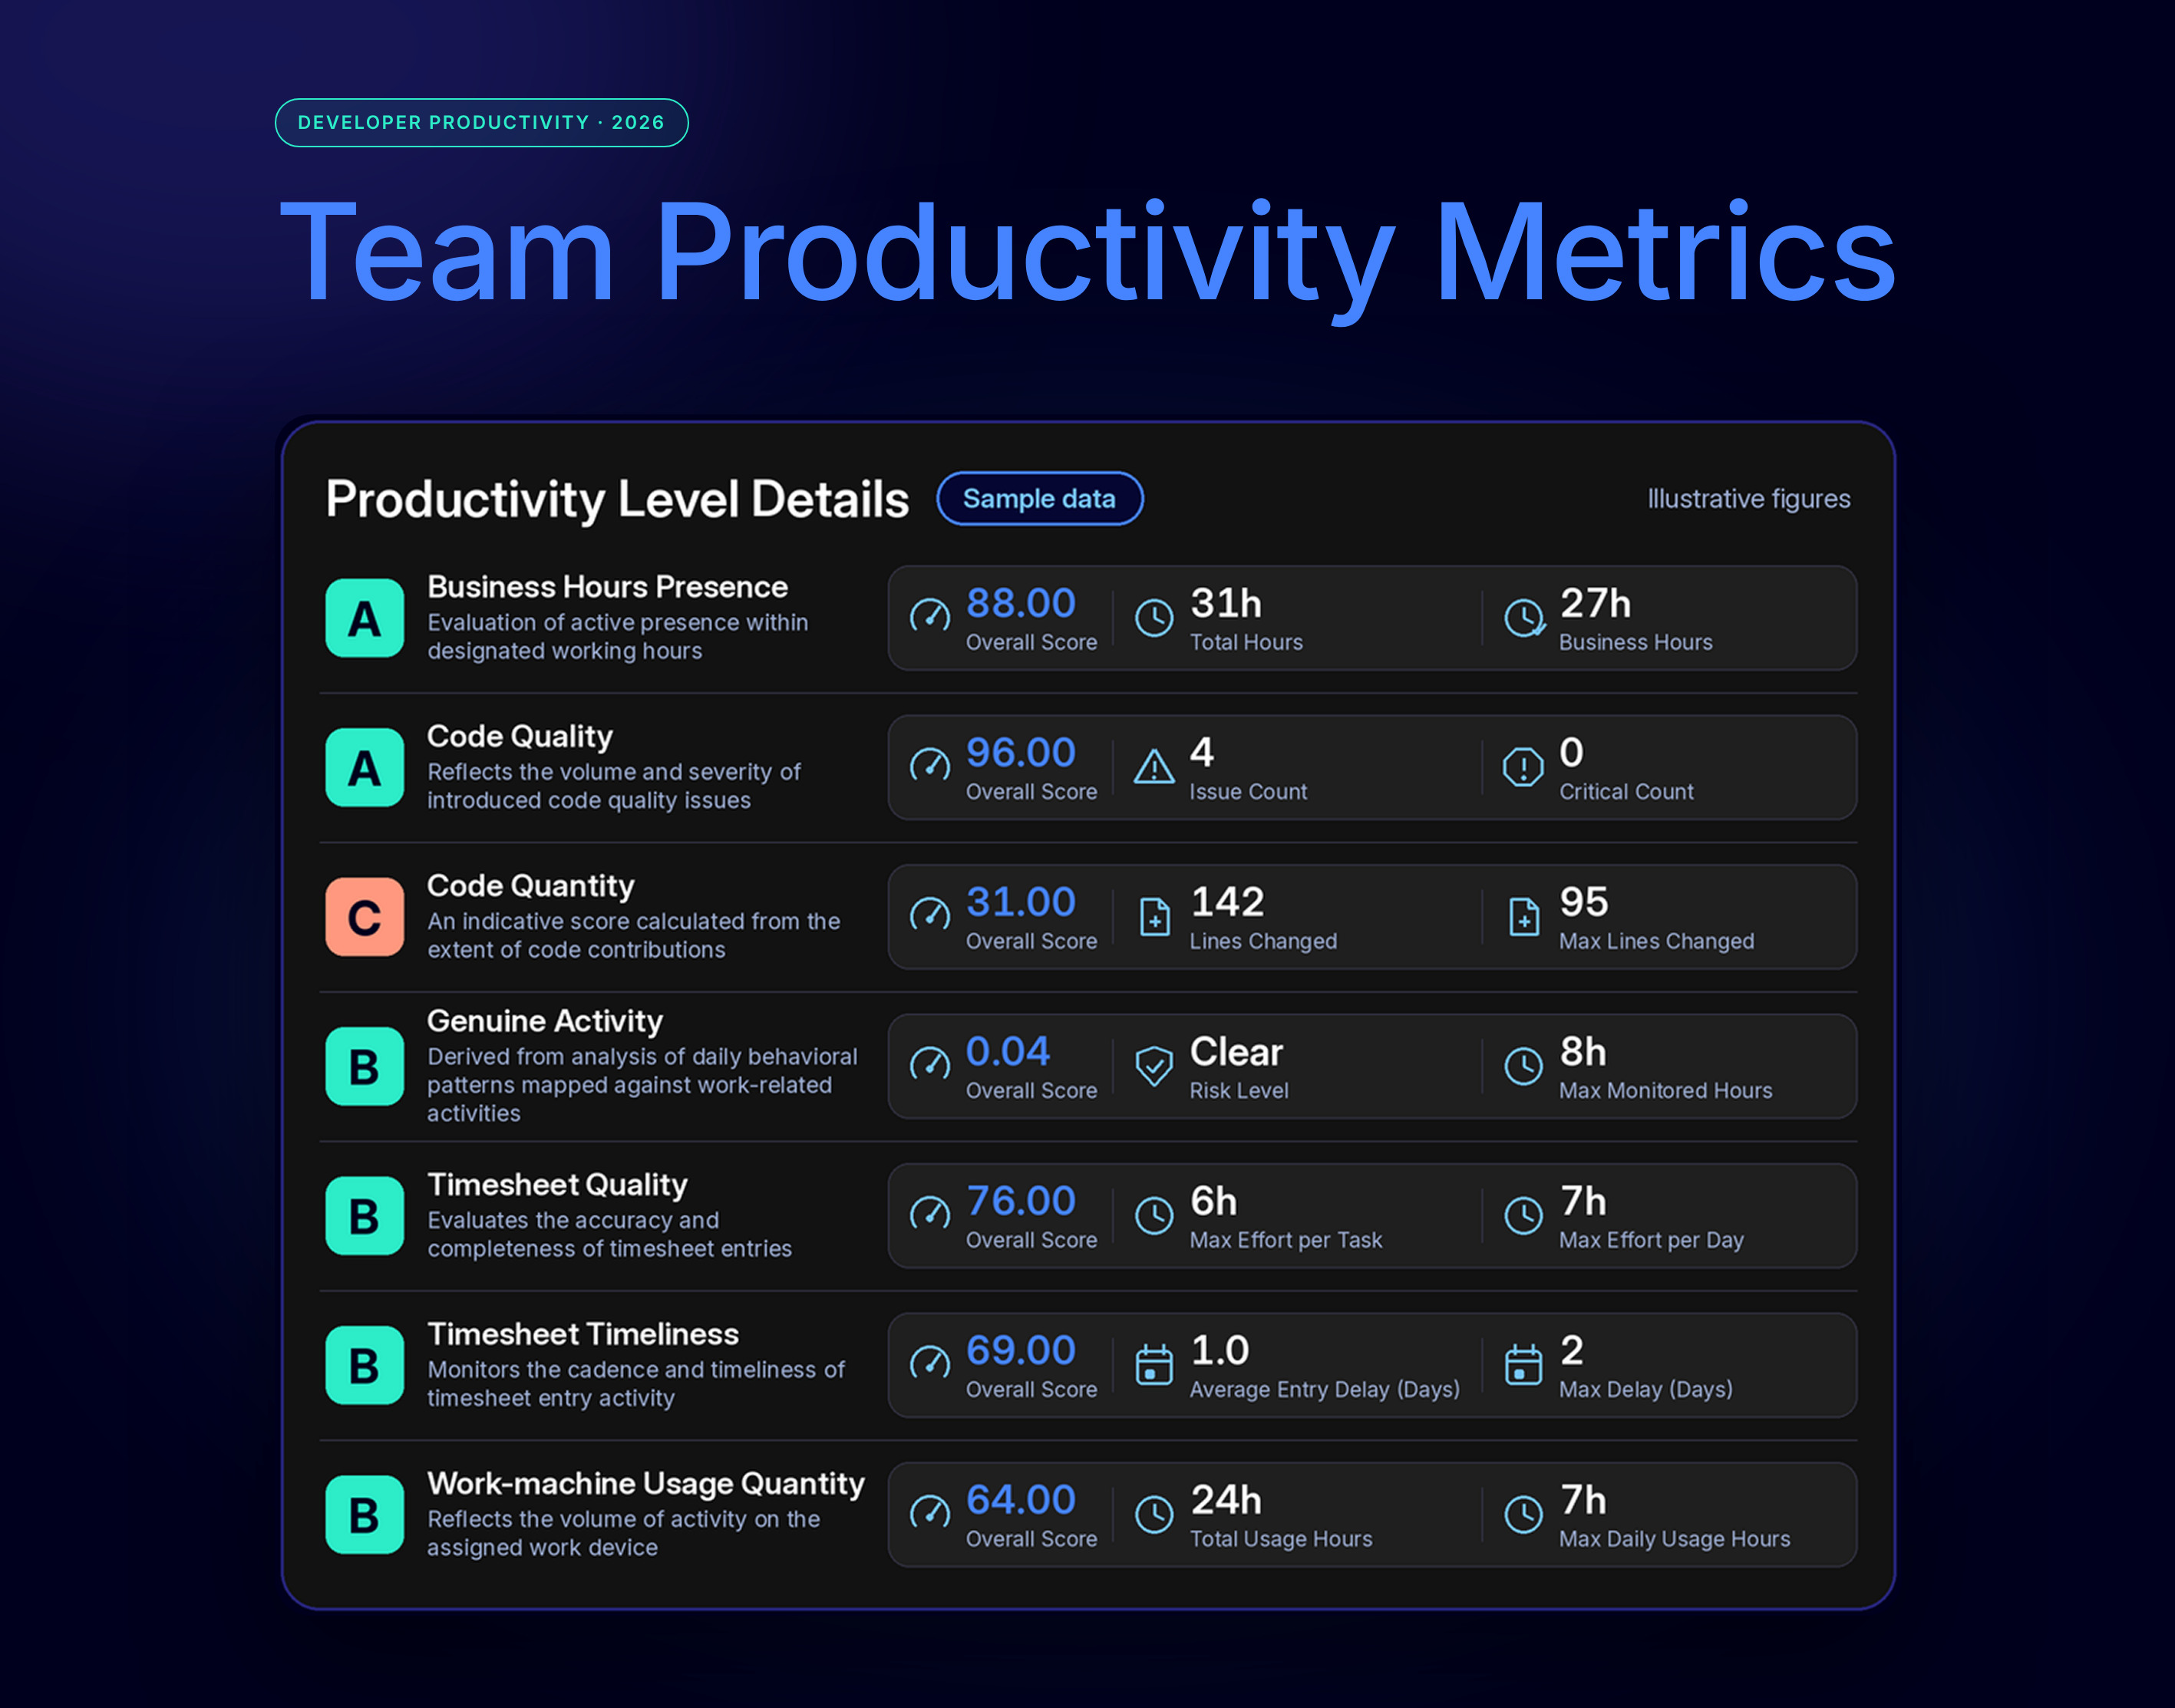
Team Productivity Metrics gives each engineer a weekly set of measures, adds a summary of the whole team so a manager can see whether things are improving, and finishes with weekly recommendations. It draws on three sources: how the work machine is used, the timesheets engineers enter, and their code contributions. HIQ turns them into seven measures, each with a letter grade, an overall score, and two supporting figures.
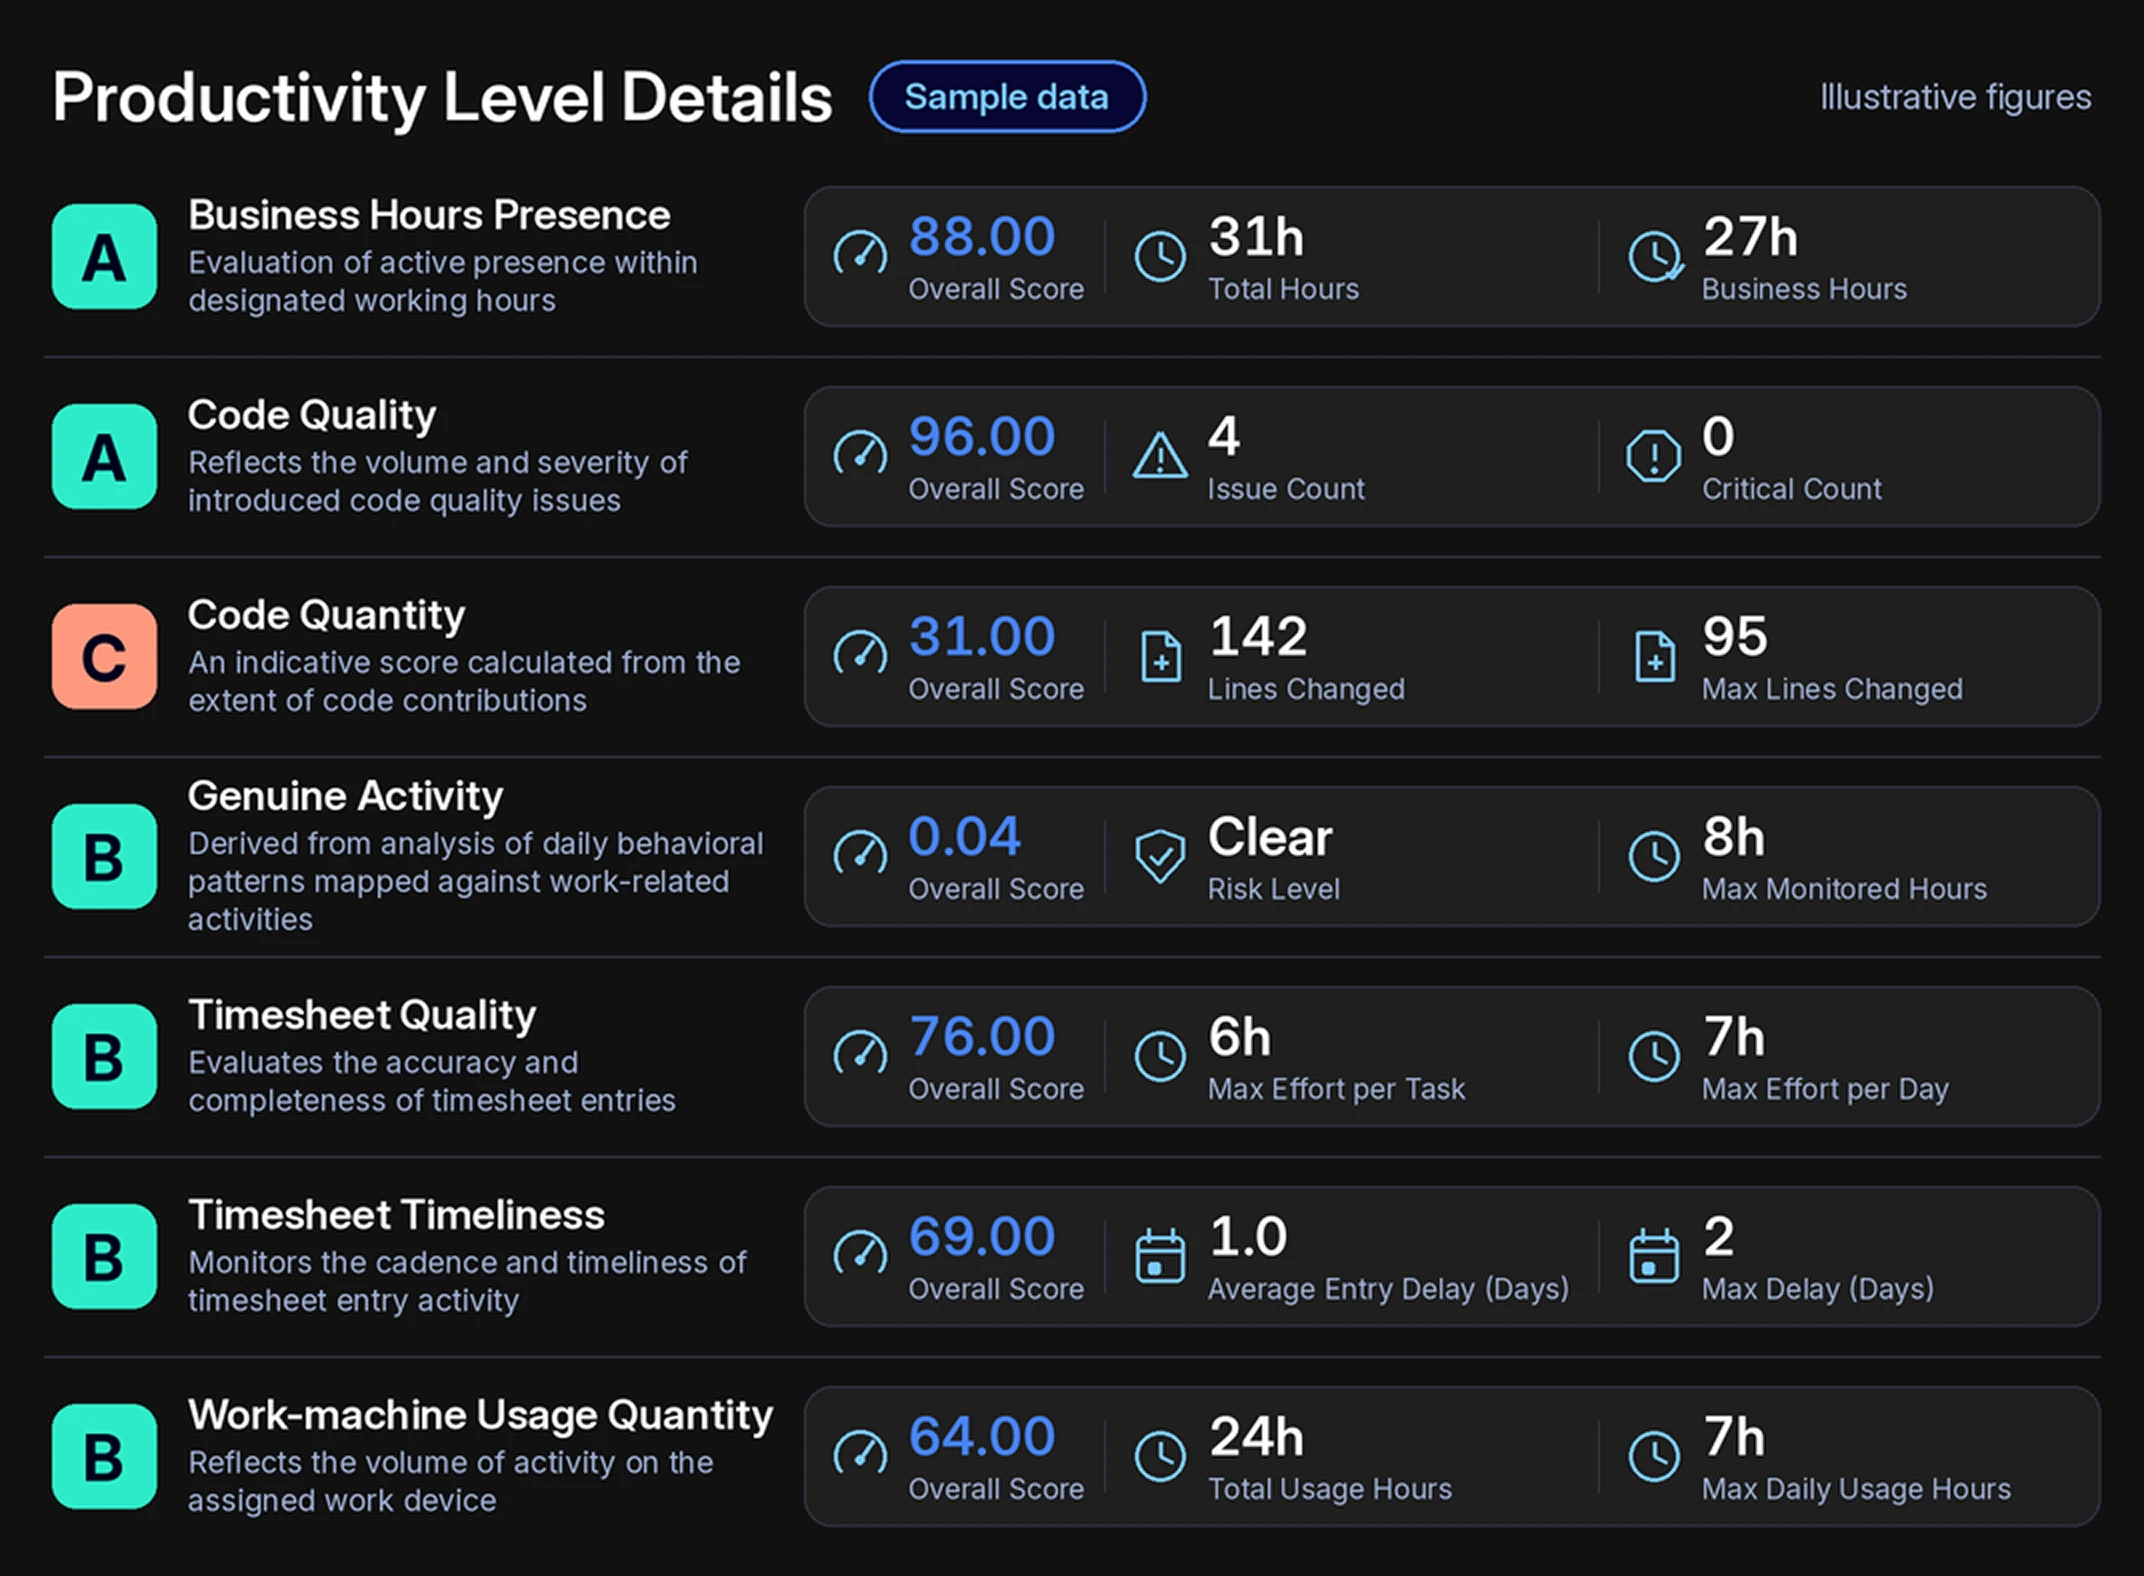
[[sections Business Hours Presence | Active presence within designated working hours, which matters most when manager and engineer sit in different time zones. || Code Quality | The volume and severity of quality issues introduced, which shows whether speed is creating work for someone later. || Code Quantity | An indicative score from code contributions. It indicates output without judging its value, so it is read next to quality. || Genuine Activity | Daily behavioural patterns mapped against work-related activities, which separates time at the machine from time spent working. || Timesheet Quality | The accuracy and completeness of entries, which affects how far a manager can rely on the hours recorded. || Timesheet Timeliness | The cadence of entries, which shows whether hours are recorded while they are still fresh. || Work-machine Usage Quantity | The volume of activity on the assigned work device, a basic view of how much of the paid time the machine is in use.]]
The sample data above shows one engineer’s week, with a letter grade for each measure. An A means better than average and a C means worse than average, and the grades get more accurate as the system collects more data.
How the Data Is Handled
[[cards 01 | What data does it collect? | Only enough to categorise the type of work being done. It does not collect data that could contain personal or company information. || 02 | Where does the analysis happen? | Inside the work machine. HIQ has no access to the data collected, and the data does not leave the machine. Only the resulting numbers do.]]
That is how the measures stay close to the work without reading it. They follow the type of work being done and have no view of what the work contains.
What Would a Weekly Productivity View Show for Your Team?
AI Productivity Insight turns the week’s scores into a short summary for the manager, with recommended actions. A manager can run it on demand, and it also arrives by email each month. The recommendations are for the manager to review and act on.
That lets a manager see which of the seven measures needs attention first without working through the whole dashboard.
[[callout What the AI sees | Only the final scores. Everything is calculated inside each engineer’s work machine, and no machine or timesheet data is sent to an AI provider. The summary exists to save managers time and help them make quick decisions without analysing the data themselves.]]
[[cta If you want to see Team Productivity Metrics and AI Productivity Insight on your own team, we’ll walk you through the weekly view. | Book a Discovery Call | https://happeningiq.com/schedule-an-audit]]